Inside the .NET Compiler Platform – Performance Considerations during Syntax Analysis (#SpeakRoslyn)
Motivation
The new Microsoft .NET Compiler Platform (Roslyn) provides APIs for the whole compilation process, beginning from syntax analysis, over symbol analysis, binding and code generation. You can access the results of each phase through object models exposed by specific APIs. There are language-specific APIs and object models for C# and Visual Basic which are similar in shape but which have high fidelity to their language. On top of the compiler services there is the workspace API. The workspace API let’s you organize solutions in one object model with direct access the the compiler services.
All these objects models exposed by the APIs are immutable. That means, that changes in code are not reflected in the object model. You have to go through the compiler phases each time you change the code in order to reflect changes in the model. Changing the model (e.g. add or remove expressions like methods or class declarations) means that the whole syntax tree must be re-spinned (re-build from the bottom up). Further, Microsoft Visual Studio 2015 was completely redesigned to use the .NET Compiler Platform. Refactorings, diagnostics, code fixes, find references, go to definition and so on are re-implemented using Roslyn.
So imagine: if there is a big solution with many projects and classes and you want to do a refactoring over this solution, all the syntax trees and symbol tables are in memory and must be re-spinned when executing the refactoring. Then the code must be generated and written to the source files.
Time to have a look at the performance and memory consumption of Roslyn.
Test Setup & Execution
The test setup is not very academic. I just want to show my first not-in-deep analysis and the results when using Roslyn compiler APIs for syntax analysis. I used the new diagnostics tools in Visual Studio 2015 CTP 5 for my performance analysis. These tools are very helpful and they provide a very user-friendly UI to do things. To analyze memory consumption I create a code snipped for Roslyn syntax analysis that looks like figure 1:
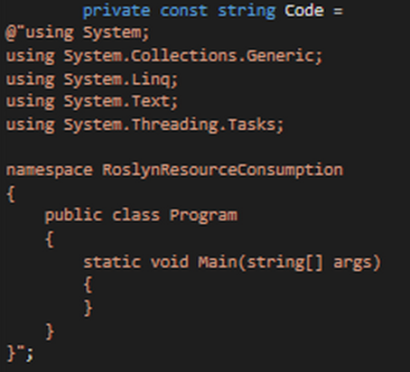
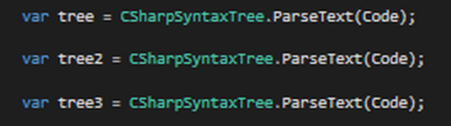
This code is used with the Roslyn syntax analysis API. To measure memory consumption, I load the syntax tree for this code snippet several times. Loading the syntax tree for the code is as simple as shown in figure 2:
Then I analyze the memory heap after each step (parse of tree). As mentioned above, I do this with the Visual Studio diagnostics tools that are new in Visual Studio 2015. These tools are starting directly whenever you start the debugger. CPU utilization, RAM usage etc. are monitored, recorded and plotted into a diagram. Debug outputs, events etc. are shown in some list views as well as markers in the timeline diagrams…
Behind the tab “Memory Usage” in the diagnostics tools you can find some very helpful tools for heap analysis: This view lets you take snapshots of your application at any time. When creating a snapshot, the complete heap, including all existing objects and values etc., will be stored. Later all the information can be analyzed – per snapshot! The tools let you deep-dive into the object instances, their memory consumption and other performance indicators.
You can investigate the state of your application, the RAM, the call stacks etc. for every arbitrary point of (run)time while the application is running or was running. Information will be available after the debug session ended. There are a lot of useful things in the diagnostics tools! Check out the details here!
For my investigations I took snapshots of the heap after each parsing of the code, means after each line of code shown in figure 2 above.
Results #1
You can see the results below in figure 3. Please note the four snapshots in the lower window section. Each snapshot is shown as a tile with some key information, e.g. number of objects, memory usage and the diffs of both in comparison to the previous snapshot. So we can see how the number of objects and the memory usage evolves from snapshot to snapshot.
In my test scenario, snapshot #1 shows the memory usage direct after application start. There are 1.201 object instances at the heap using 125 KB memory. Snapshot #2 was taken directly after the first call to CSharpSyntaxTree.ParseText (used to parse the code shown in figure 1). As you can see in figure 3, there are 2.866 object instances at the heap using 2.448 KB RAM. That is an increase of 1.665 object instances and 2.323 KB memory usage compared to snapshot one.
That means, that building the Roslyn syntax tree takes about 1.665 object instances. Consider that this is not completely correct here, because the diagnostics values cannot be attributed to my single line of code. Taking a snapshot walks the managed heap and counts all objects that are alive – for every thread! So we have to be a little bit careful here, but it is correct enough to get an idea of the involved object count and the syntax tree memory usage.
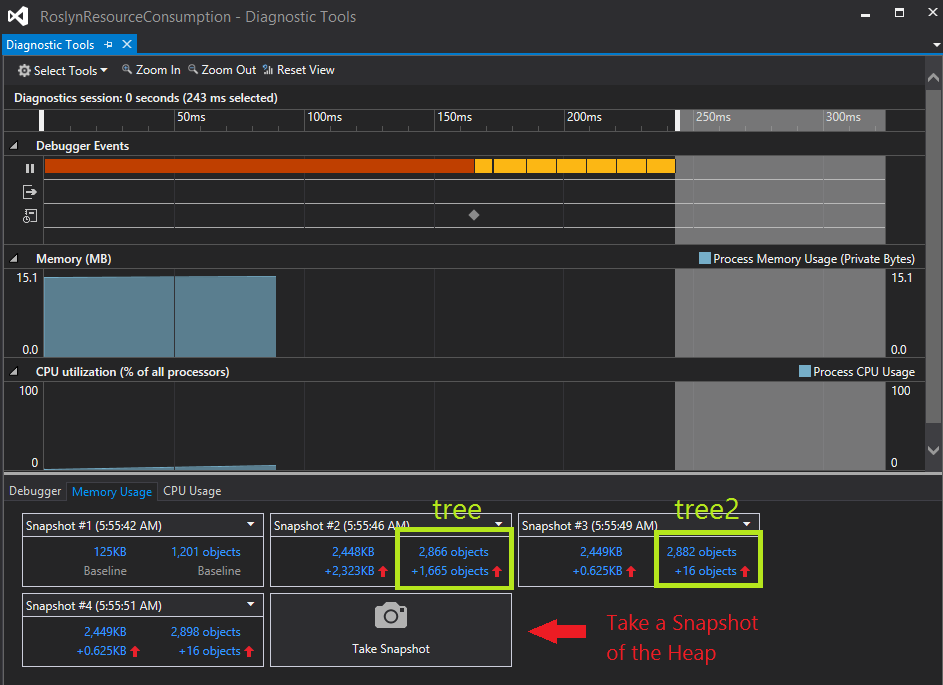
Let’s have a look at snapshot #3. This snapshot was created after calling CSharpSyntaxTree.ParseText a second time with the same code to analyze. It was exactly the same call as before snapshot #2. One could expect that a second syntax tree is created with a second parse action. But looking at the number of new objects and the increase of memory usage refuse this assumption. Only 16 objects were created with an increase of 0,625 KB memory usage. CSharpSyntaxTree.ParseText was called a third time in my scenario. Snapshot #4 was taken after that call. Same as in snapshot #3.
So, 16 objects are not enough for a complete new syntax tree of the given code. So there must be some kind of caching. I will explain this later in this blog post. But let’s do some further syntax analysis before.
Results #2
Figure 4 shows the results of the second phase of my tests. For phase 2 I added a second code snippet that differs from the first snippet. I analyzed the syntax tree of this code several times and take the snapshots as I did for the first code snippet. Phase 1 and 2 were executed in one run.
Have a look at snapshot #5. This snapshot was created after the second code snippet was analyzed for the first time. As you can see, only 62 objects were created using only 2 KB memory. Compared to snapshot #2 where the first code snippet was analyzed for the first time, we have much less objects created. So cached data from the first syntax tree must be somehow reused for the second syntax tree.
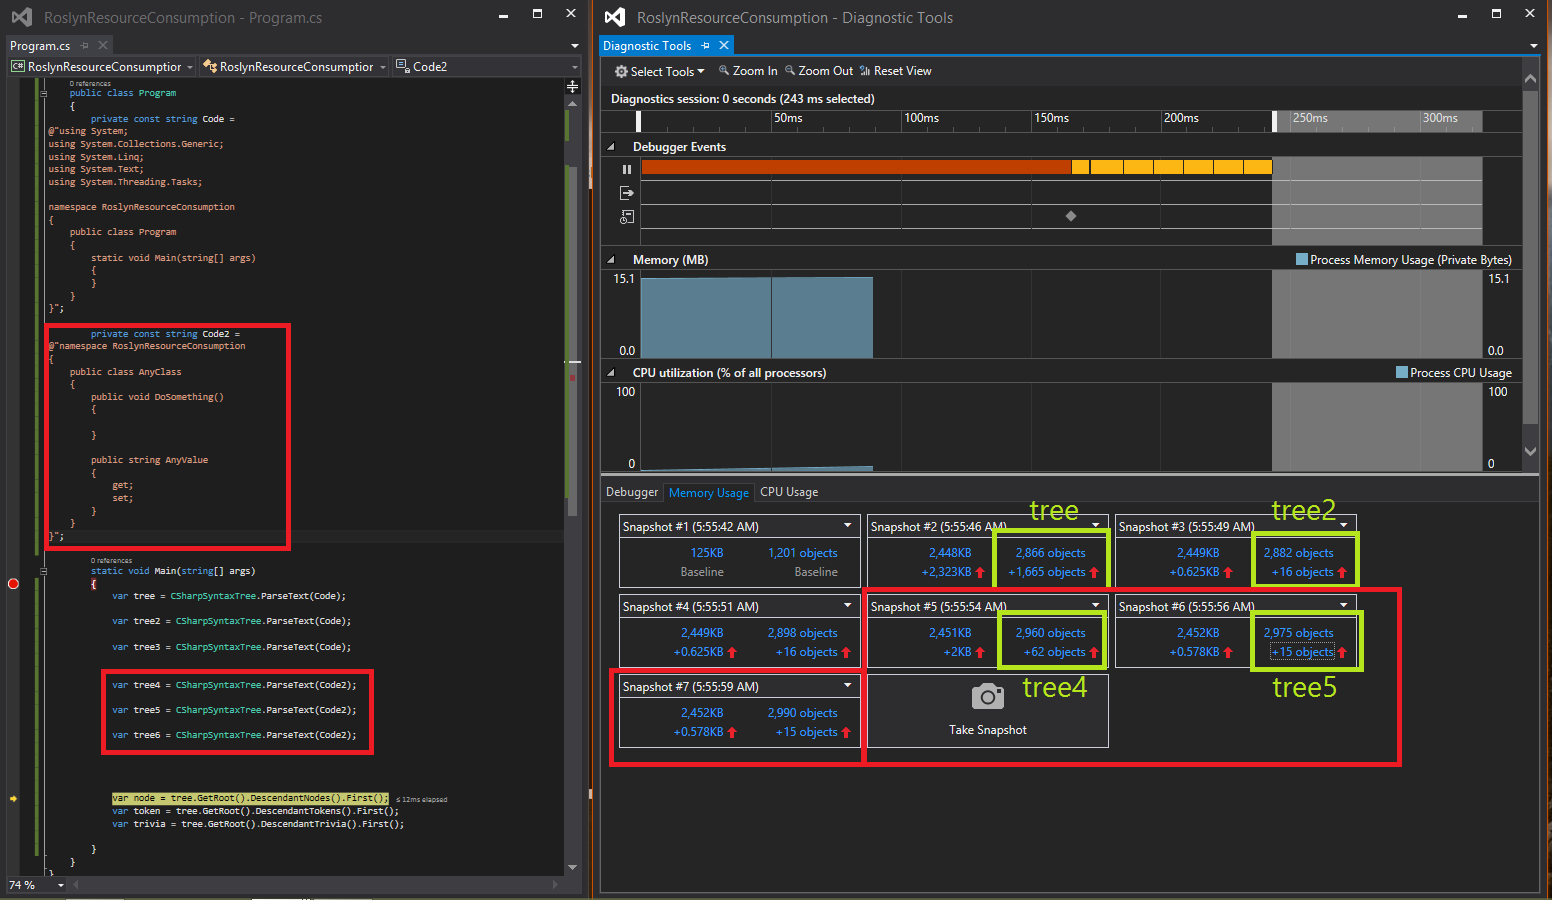
Snapshots #6 and #7 (which were taken after the second and third syntax analysis of the second code snippet) show only 15 new objects with 0.578 KB increase in memory usage. The cache take effect again and so snapshot #6 and #7 can be compared to #3 and #4 (please read section “Results #1″ above).
The results of the diagnostics measurements shows that there must be some kind of AppDomain-wide caching in the Microsoft .NET Compiler Platform implementation. In the next chapter I will explain my understanding of the caching in Roslyn.
Note: You can click on the blue numbers in the snapshot tiles of the Visual Studio diagnostics tools. This leads you to a view were the heap can be investigated in detail (as mentioned above). Navigate through used types, instances and so on.
Internal Syntax Tree Representation
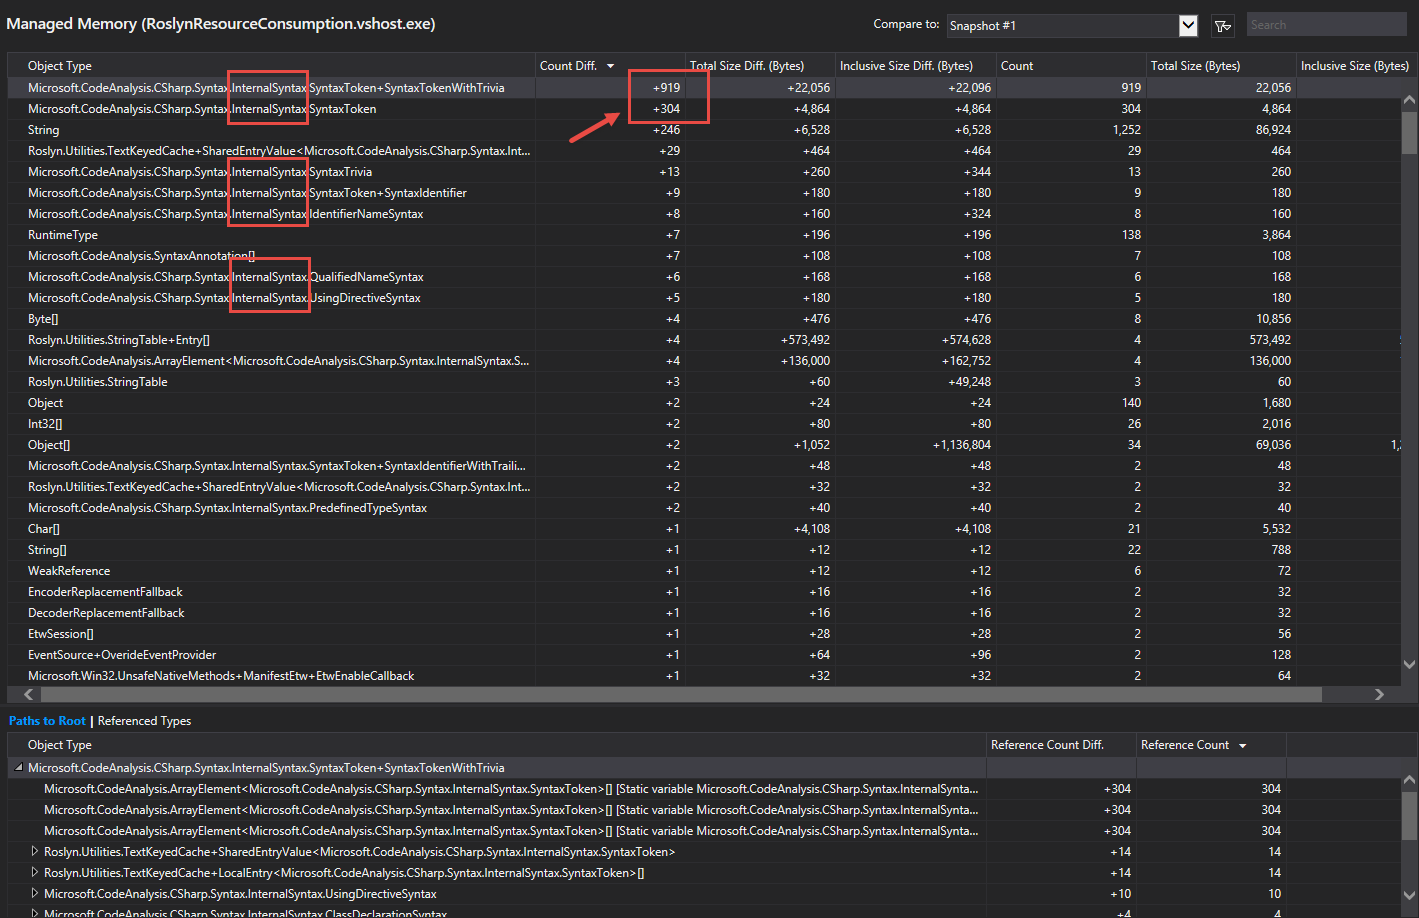
If you follow my example live in Visual Studio, you may have noticed that I am not talking about the public object model above. Figure 5 below shows a deep-dive (using the diagnostics tools) into the heap from the example above. As you can see, the majority of objects are of types that come from the Microsoft.CodeAnalysis.CSharp.Syntax.InternalSyntax namespace. Those types are internal. The public object models that you can access via the Child*- and Descendant*-methods of nodes, tokens and trivia are instantiated on demand. So objects are created when you ask for them. Above, we look at internal data structures of Roslyn used to built the syntax tree.
This is an internal implementation strategy of the Microsoft .NET Compiler Platform. The implementation uses an immutable syntax tree internally. Once the code was parsed and the tree was created, it never changes. That is called the Green Tree. This Green Tree is wrapped by the Red Tree. The Red Tree is an immutable facade and is rebuilt every time the underlying text buffer changes. Therefore, it uses the wrapped Green Tree. The Red Tree provides the data structures that are exposed by the public APIs. Reasons for this design are memory and performance considerations for the .NET Compiler Platform as well as some problems popping up when using immutable data structures. You can read more details about this topic in Eric Lippert’s blog here.
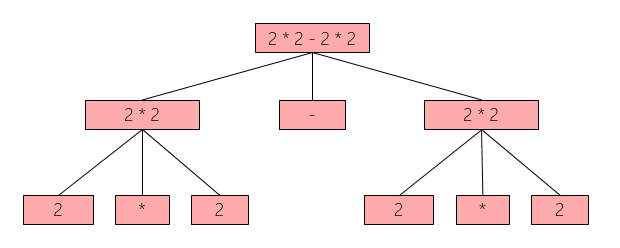
I took the following example from the explanations of Vlad Sadov. Imagine that you have this expression: 2 * 2 – 2 * 2. Via the public API you will get the syntax tree shown in figure 6.
Of course, all these nodes are not equal because each node has a parent and a position in the source code. That’s immutable to the user of the public API. But if the parent and the position in text can be ignored, some nodes gets more similar resp. they are equal. This leads to the internal representation of the green tree shown in figure 7.
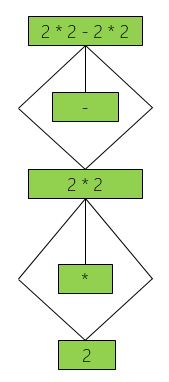
As you can see the internal green tree has half of the size the red tree has. Nodes are equal because parents and text position are ignored at this time. And so a lot of nodes can be reused. The red syntax tree can then be generated based on this green tree. Parent relations and text positions will be added to the nodes of the red tree when it is generated.
Since the parser looks for already seen green nodes in the underlying caches during a parsing session, the red-green tree strategy reduces memory consumption as well as parsing time. There are some trade-offs when reusing green syntax nodes. You can read more about the trade-offs in the explanations of Vlad Sadov.
Cache Implementation
How the Parser works
Now we know the underlying design and strategy to represent syntax nodes in Roslyn. But how does the caching work in detail? Time to look into the Roslyn source code. We start in the CSharpSyntaxTree class, especially with the ParseText method. The class can be found in the namespace Microsoft.CodeAnalysis.CSharp. Figure 8 shows the implementation of the ParseText method.
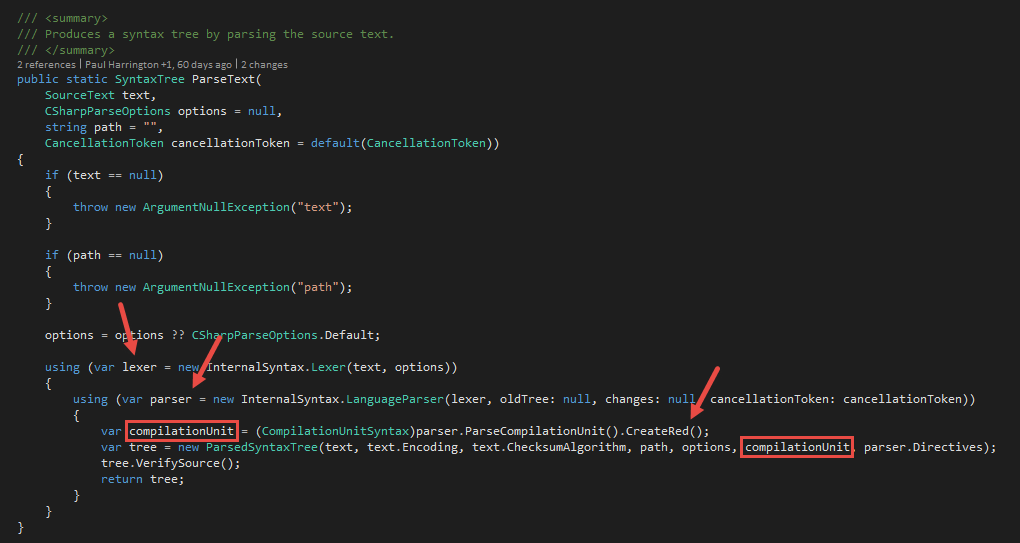
Each time the ParseText method is called, a new parser is created. This parser is used to parse the code, create the syntax tree and return it to the caller. The root node of the syntax tree is always of type CompilationUnitSyntax. At this point, CompilationUnitSyntax is the internal type from the InternalSyntax namespace (part of Green Tree). The method CreateRed is called on this root node to create the public object for the root node (part of Red Tree). This object is then used to create the syntax tree object that is returned by the ParseText method.
As mentioned above, the public object model is not created here, except the root node of type CompilationUnitSyntax. All other public objects are created on the fly when you access them. But this only by the way, we’ve already discusses this in the previous chapter. Regarding caching, the more interesting things happens in the step before. At the lexer.
The lexer is the very first component/phase of a compiler. The lexer reads the source code and breaks it down into tokens defined by the language grammar. The lexer is also called “Tokenizer”. With every call of the ParseText method, a new instance of the lexer is created. As you can see in figure 8, the lexer takes the source code and some options. This new lexer instance is then used in the language parser.
The LexerCache
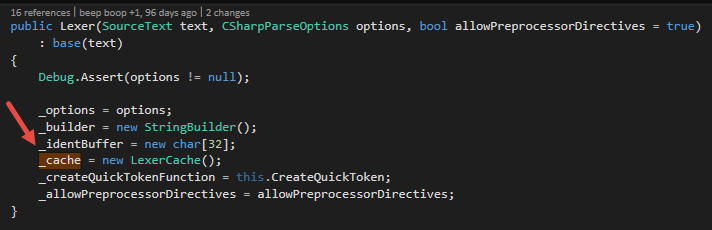
Let’s have a look into the lexer. Figure 9 shows the constructor. As you can see, the lexer creates a LexerCache instance. This is the cache for the specific lexer for one parsing process. It is used to caches tokens and trivia.
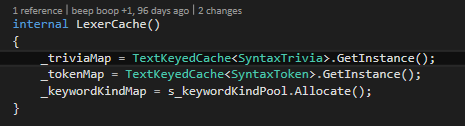
The lexer cache itself uses the TextKeyedCache under the hood. Figure 10 shows the constructor of the LexerCache class. There are 2 TextKeyedCaches. One for trivia and one for tokens. The lexer cache tries to find an already seen trivia or token in the underlying TextKeyedCache. If it does not find the item in the cache, it creates a new trivia or token an puts it into the cache. One could argue, that the LexerCache class is an unnecessary layer. I gave this feedback to the Roslyn team. And indeed, in a direct talk with the team, they admit that the LexerCache class is some kind of historical code. So don’t take me serious here, but maybe they will eliminate this class in later version and merge the functionality into the Lexer class.
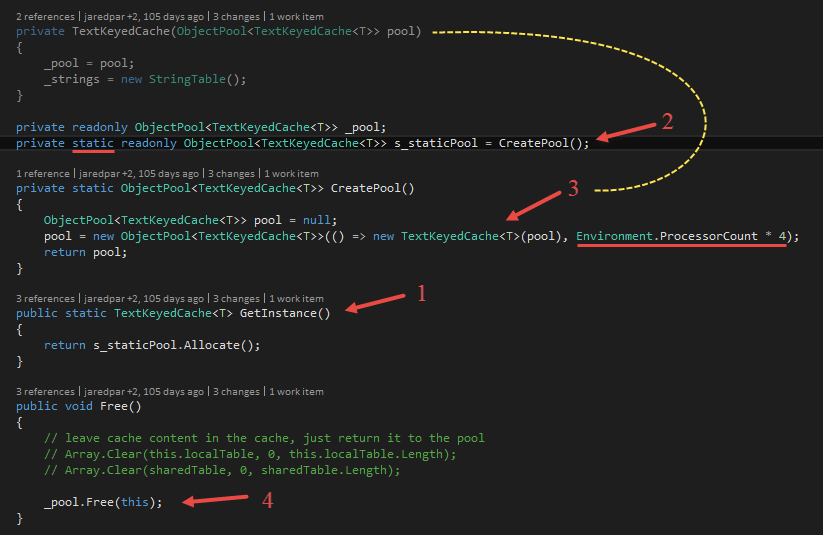
As you can see in figure 10, TextKeyedCaches are acquired via the static GetInstance method. Figure 11 shows how that works internally. The static GetInstance method from the TextKeyedCache uses an object pool to allocate an instance (1). The object pool is global for an application (2). The object pool can manage 4 * processor count instances of the TextKeyedCache. Whenever the object pool decides to create a new instance of the TextKeyedCache it calls the method given by the lambda in (3). That is if all pooled caches are in use or if there is no cache in the pool. The lambda is given to the object pool because the pool is a generic pool for instances of T. So calling default(T) to create a new instance is slower than providing a direct method (lambda). Further, the TextKeyedCache instance needs to store a reference to the pool.
At the end of a parsing session, the LexerCache class calls the TextKeyedCache.Free method (4). This method frees the cache not really, but puts it back into the object pool. So the cache can be used by another parsing session in the current application domain.
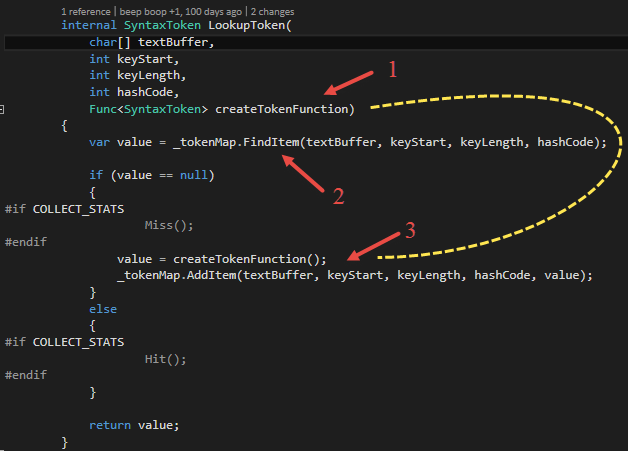
Whenever the lexer finds a token in the text, it tries to looks up this token in the lexer cache. Figure 12 shows the lookup method for tokens in the LexerCache class. If it does not find the token (2), the lexer cache calls the createTokenFunction (3). This function is given as a parameter to this lookup method in order to create the correct token type. The lexer knows which type of token must be created, the cache does not. So passing the create function is a convenient way (1). The newly created token is then added to the underlying TextKeyedCache.
The TextKeyedCache
The TextKeyedCache is used to cache generic items with their text representation and a hash code (the Microsoft .NET Compiler Platform team uses the Fowler-Noll-Vo hash function to calculate hash codes). The LexerCache uses the TextKeyedCache to cache already seen tokens and trivia (as mentioned above).
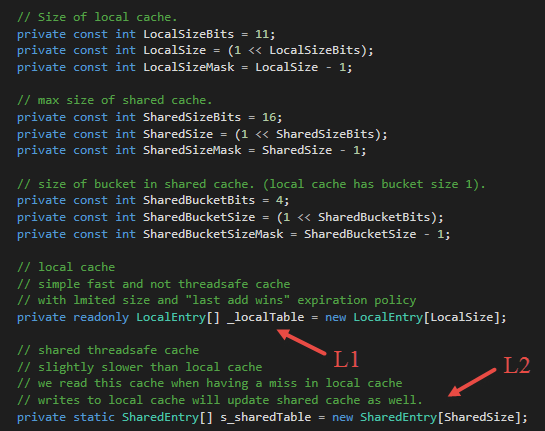
The TextKeyedCache uses two levels of caching. Figure 13 shows the L1 und the L2 cache. The L1 cache is a local non-thread safe cache used by the concrete instance of the TextKeyedCache for very fast access. It is designed to fit into the CPU cache. The L2 cache is a static and so shared cache that is used by several instances of the TextKeyedCache.
Figure 14 shows how the lookup in the TextKeyedCache works. The method FindItem looks for an already seen text in the local cache (L1) first (1). The index of an item in the local cache is computed by the hash code of the item and the size of the cache. If no item is found, the TextKeyedCache looks into the shared cache (L2) if the item has been seen by another instance before. If so, the shared entry is put into the local cache in order to access the item faster the next time it occurs. Then the item will be returned.
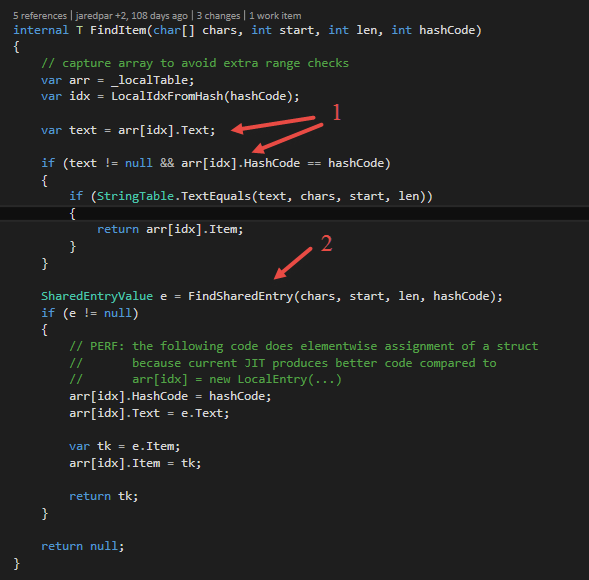
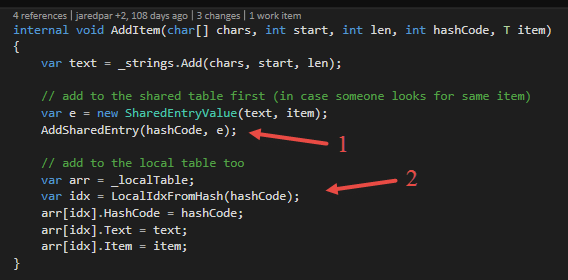
If the item cannot be found in the local and shared cache, null will be returned. Then the lexer cache creates the item and puts it into the cache (please see above in the chapter “The LexerCache”). Figure 15 shows the AddItem method of the TextKeyedCache. A new item will be add to the shared and the local cache. So other instances of the TextKeyedCache can find the item, too.
The LexerCache and the TextKeyedCache are designed to make as many tokens and trivia reusable for the same and other lexer instances where the caches are optimized to fit into CPU caches as well. This lowers object count and increases performance of the lexer and parsing phase.
The QuickScanner
Last but not least: the QuickScanner. When I started to write this blog post, my aim was to write about the low object count during syntax analysis. That’s why I talked about the caching mechanisms first. But then it went into a wider view on performance considerations in the .NET Compiler Platform and so we cannot ignore the QuickScanner. It brings the most performance boost to the parsing phase.
The QuickScanner is part of the lexer. The very first part. It is a simple state machine that can lex common things like number literals, operators, identifiers like “System” and some keywords (e.g. public, protected etc.). Figure 16 shows how the QuickScanner scans a syntax token. Therefore, it takes a text and looks if it knows such text. To do this, it uses a simple state machine (1).
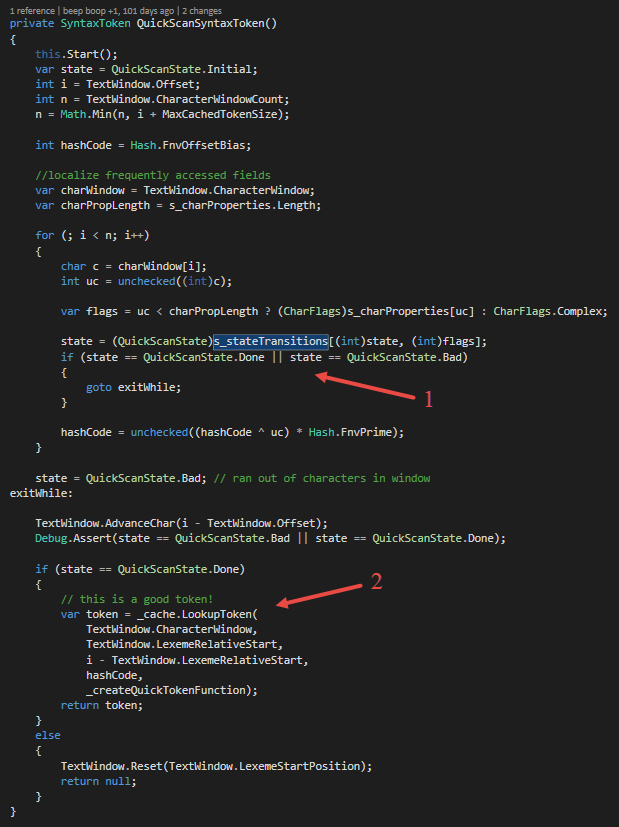
If the QuickScanner can recognize the text representation of a token, it tries to find the token in the LexerCache (2). If the token has been seen before, the cache will return it and so the QuickScanner will return it to the parser. Otherwise, the token will be created via the function stored in the _createQuickTokenFunction field. If the QuickScanner does not recognize the token, normal lexing will take place.
So the QuickScanner is designed to scan common things very fast in order to relieving the lexer.
Conclusion
Now we have seen how the lexer and parser are working internally. This post shows how tokens are recognized and how nodes, tokens and trivia are cached in order to reuse them. We’ve seen the internal caches as well as the Red-Green Tree strategy. The Roslyn team spends a lot of time in performance considerations as you can hopefully see.
Many thanks to the Roslyn team, especially Vlad Sadov, who helped me to understand all the magic that happens in the Microsoft .NET Compiler Platform regarding performance considerations.
Resources and Links
- The Roslyn Code.
- Documentation from the Roslyn team.
- Vlad Sadov’s explanations on Roslyn’s Performance (CodePlex)
- Persistence, Facades and Roslyn’s Red-Green Trees (Eric Lippert)
- Roslyn Performance (Matt Gertz)
- Direct talks to Vlad Sadov on Gitter
| Reference: | Inside the .NET Compiler Platform – Performance Considerations during Syntax Analysis (#SpeakRoslyn) from our NCG partner Robin Sedlaczek at the Robin Sedlaczek’s Blog blog. |