Learn how to access useful information from your Angular 2 components right from your browser’s console
There have been some quite useful articles for
how to debug Angular 1.x applications from the browser’s console. But how can we achieve the same in Angular 2? Is there even a way? Let’s see.
I always found it quite neat how to debug my Angular 1.x applications directly from my browser’s console. Take Chrome’s devtools for instance. You can open the Elements tab and click on your Angular 2 component. The nice thing about the Chrome devtools is that it’ll keep a reference to the selected DOM node in the variable $0 which you can then directly access from the console.
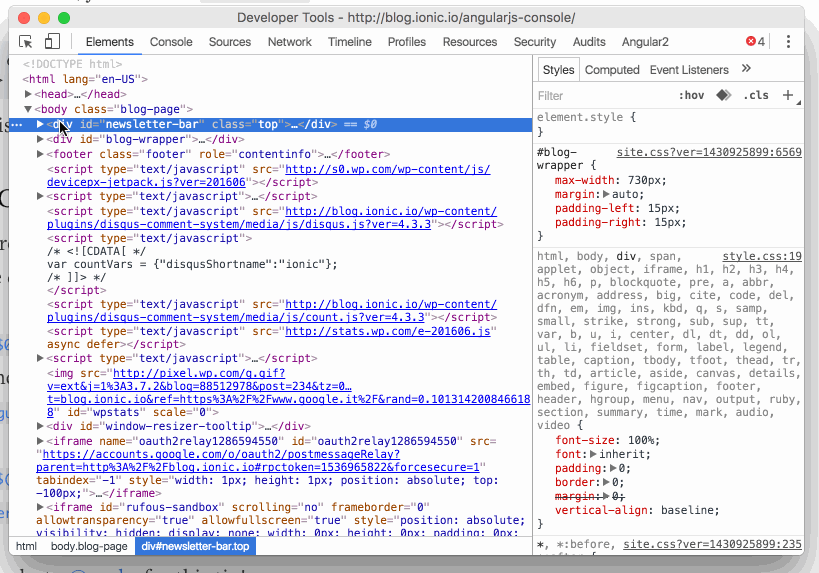
From there in Angular 1.x you can simply write..
> angular.element($0).scope()
..to access the $scope of that directive and interact with that object accordingly. Similarly you can get hold of the dependency injector for fetching services etc. But more on that in this article on the official Ionic blog.
Enabling/Disabling Debugging
Note, if you’re using Angular 2 beta.02 or lower, you have to explicitly activate debugging by importing the ELEMENT_PROBE_PROVIDERS from angular2/platform/browser and pass it as provider to your bootstrap function.
By default debugging is enabled in Angular 2 applications. In fact when you run your app you might see a log in your console saying something like:
“Angular 2 is running in the development mode. Call enableProdMode() to enable the production mode.”
In fact, whenever you deploy your application you should disable debugging information and switch into production mode. You can do that like this:
...
import { enableProdMode } from 'angular2/core';
// enable production mode and thus disable debugging information
enableProdMode();
bootstrap(HelloAngular2, [])
.catch(err => console.error(err));
Note, the same holds for your Angular 1.x apps.
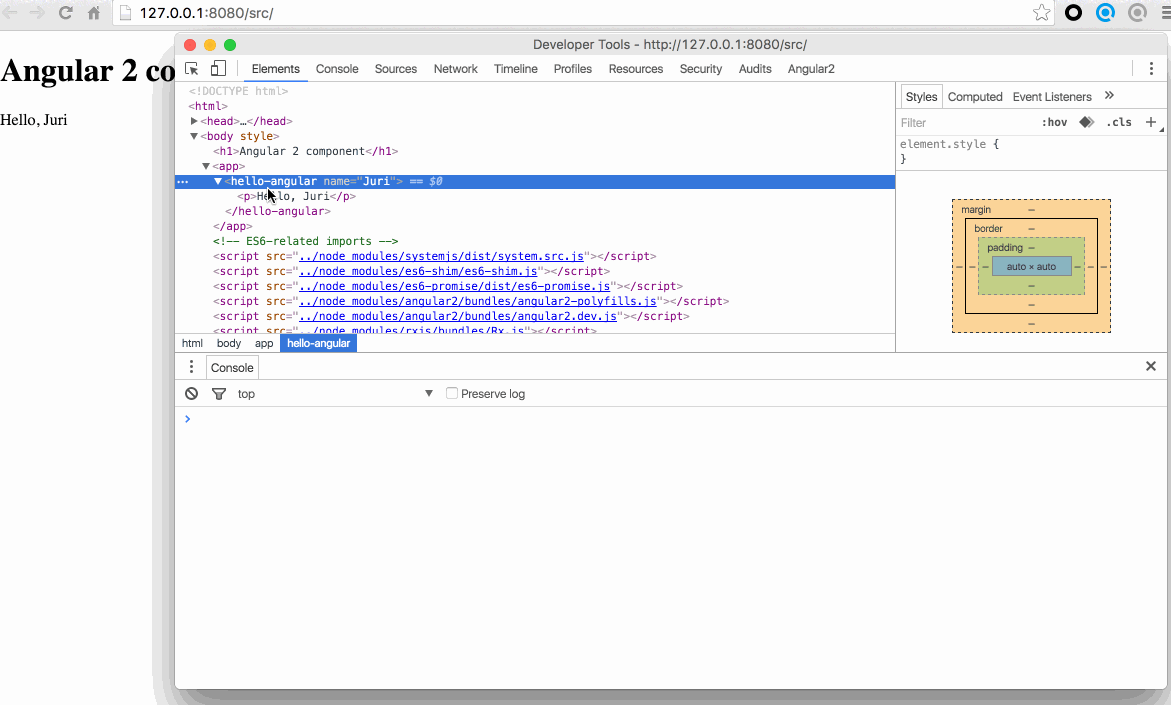
Inspect the Component state
The interesting part is to inspect the current state of our rendered component. We can do this by again selecting our component in the elements tab and then executing the following in the console.
> ng.probe($0)
Expand the result object in the devtools and navigate through it. There are are a couple of interesting things being exposed to you. Most interestingly, we can get a reference to the instance of our component class using..
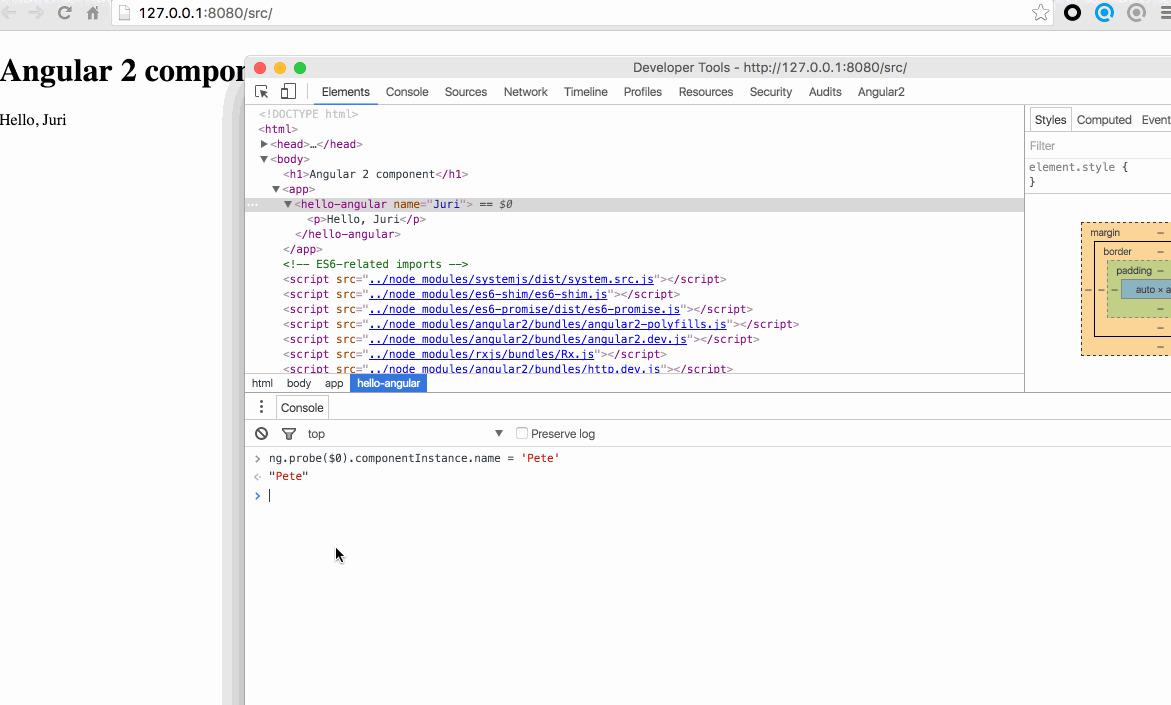
> ng.probe($0).componentInstance
Once we have that instance, we can interact with it, like changing the name property in the case of our simple hello world component example.
Strange enough, the UI won’t reflect our changes. Well remember $digest(). Angular 2 has a similar, but more advanced mechanism. Anyway, without going into the details, we need to invoke that change detector.
I dug through the Angular source and this was the best way I could come up with to activate the change detection mechanism:
> ng.probe($0).injector._depProvider.componentView.changeDetector.detectChanges()
Not sure if you noticed, but we invoked the change detector on our selected Angular 2 component ($0) and not globally. This is because change detection is hierarchical, hence, every Angular 2 component get its own change detector. Victor Savkin has written an awesome post on this.
Here’s the result of executing the change detector:
Batarangle
If you’re not the console type of guy, you may appreciate the visual debugging tool Batarangle from Rangle.io.
Conclusion
That’s it. I’ll try to keep this article updated and even extend it with further debugging possibilities as Angular 2 evolves towards its final release. Also, if you have any suggestions/improvements, as always, comment!
Btw, you can use my Angular 2 playground setup to test out these features.
| Reference: | Debugging Angular 2 Applications from the Console from our NCG partner Juri Strumpflohner at the Juri Strumpflohner’s TechBlog blog. |