RavenDB is a critical system for many of our clients, that means that we get our share of “the sky is falling” stories, and we have a team of people we train to be able to diagnose and troubleshoot issues in production. This series of post is about the kind of issues that we run into, how they were resolved, and what the underlying issue was.
The scenario, a customer had a total system meltdown because RavenDB would stop responding to requests. Restarting the server would result in everything working, but in about 10 minutes, they would run into the same issue.
Complicating matters was the fact that the customer was running in a high availability cluster, with two quite powerful nodes that had failover setup. However, the problem would typically impact a single server, eventually leading to it stopping processing requests, while the second server would be humming along beautifully. When the first server would stop, the second server would continue for a few more minutes, then die in the same manner.
The issue was clearly related to the load on those server. The website is pretty busy, with millions of queries to RavenDB per hour, but we had no reason to think that the system was over capacity. Why is that?
- The system has been running around for over a month on the same configuration, with moderate memory consumption and low CPU usage throughout that time.
- The last upgrade to the RavenDB servers happened about a week ago, and no new traffic patterns should cause that load.
- The last RavenDB client upgrade happened that morning, but it was a minor change and should reduce load on the server. But the problem would show up within 10 – 20 minutes, and the client upgrade happened several hours before it started happening.
- The operations team swore that there were no changes made to either server recently.
The behavior was puzzling because we didn’t have high CPU, high memory or paging. Typical indications that the system is under too much of a load. Furthermore, I/O rates were quite good, and testing the disk speed and throughput showed that everything is all right.
We tried to revert all recent changes, to both clients and servers. We monitored the servers to see what happens when the problem recurred, and eventually we figured out what is the probable issue. The affected server would slowly show a growth pattern in the number of threads being used. Slowly going to upward of 700 threads. The non impacted server would sit on around 100 threads or so, until the first server would fail, in which case all load would hit the okay server, and it would be fine, for a while, then the thread count would start climbing up, the request timing would increase, and eventually things would stop.
One thing that was very interesting was that the problem was that RavenDB would still be responding (albeit a bit badly) under those conditions, and there was no indication that there are any issues with it as far as it was concerned. But under this failure condition we did see that we start getting a rather strange error.
The server is too busy, could not acquire transactional access
This rather poorly worded message is an indication that we hit an internal limit inside RavenDB. By default, we have a limit of 512 concurrent requests inside the server. That is done to make sure that we aren’t swamping the server with too many requests that would take it down. The good news was that this is a configurable value, and we were able to set Raven/MaxConcurrentServerRequests to a higher value to get a little bit more breathing space. Once we have done that, the system would still become slower, but it would stabilize at some point, even though it would still be much slower than what we come to expect of it.
Intermediary conclusions were:
- Something is causing requests to take a lot longer than they should.
- Because they take longer than they should, we see a convoy of requests.
- We can’t handle requests as fast as they come, so they start to pile up.
- The thread pool (which dispatches requests) is handling this by slowly increasing the number of threads.
- But we still aren’t able to catch up with the number of requests coming in.
- At some point, the number of concurrent requests hits the limit, and we start rejecting some requests
- We would see major slow downs because the thread pool would increase the number of threads in the pool only on a slow and measured pace.
- We don’t have any idea what is causing us to slow down.
Remember, this is a system that has been in production for a while now. In fact, the current traffic numbers are actually only about one third of the peek that was hit shortly after the system was released, and we handled that load with no issue.
We came back to the drawing board, and started look at pretty much anything suspicious. Memory was reasonable, and we have few dozens GB still free. CPU utilization was moderate, with over half of the system capacity unused. I/O rates from the disk according to performance monitor was excellent. Everything was good. So we took a dump of the process and proceeded to try to figure out what is going on from that.
We saw something like this (spread over 150+ threads and in various modes, but this gets the point):
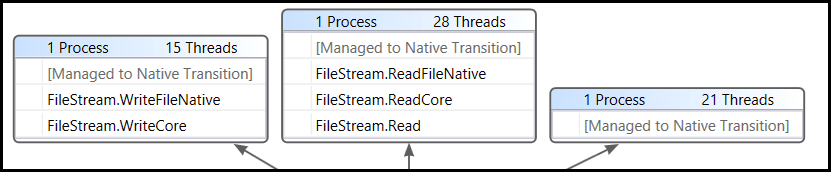
95% of the threads were stuck in various I/O related methods. Like NtCreateFile, NtCloseFile, etc. Other threads were hanging in .NET related code that was also doing file I/O. So we can pretty conclusively state that the problem is I/O related.
But what? We tested the disk I/O, it was good. We run I/O tests and they were fine. The measurements we got from the monitoring tools all said that the I/O is fine.
And yet we could see that I/O was the culprit. What the hell?!
At this point, we start suspecting that the issue was with something in the system. Now, each of the servers was capable to handling the entire load of the server (and then some) on its own. But both machine exhibit the same signs. That led us to believe that this isn’t some sort of hardware issue. It is something that both machine had.
A common trouble maker in this area is any kind of tool that hooks into sys calls. For example, anti virus software. In fact, that was one of the very first questions that we asked. Does this machine have anti virus on it? We got a negative answer early on. But after seeing those results, we went in and double checked. The machine did have an anti virus installed, and that is a huge red flag in those circumstances.
Anti virus software like to hook into all kind of system calls, and it is commonly associated with problems because of that. We asked the operations team to disable the anti virus on those servers to see if it would have an impact on the issue. Indeed, they stopped the anti virus and restarted the RavenDB servers, and then we waited. 10 minutes later, we saw no increase in the number of threads, and 25 minutes later, we were holding steady on the same performance that we came to expect.
Today, the customer sent us their monitoring system reports and there is a huge drop from 30% – 50% CPU usage to single digits on the day in question, and then it is flat graph for all the rest of the week.
Our hypothesis is that the anti virus either auto updated itself, or was actually updated by ops as part of routine maintenance task, and for some reason it has taken a liking to the kind of I/O RavenDB was generating. So it inspected us. And as it did so, it added overhead for each and every I/O call we made. And considering that we are a database, I/O is kinda of important for us. That additional overhead would cause us to respond much more slowly, which would mean that we would have additional request queue up, all the way until we start rejecting them. And we didn’t see those at the I/O metrics for the system because the overhead happen after the I/O is already completed.
I also suspect that this runs for all I/O operations, including things that should be buffered (therefor fast), so it has a big impact on our assumptions (this I/O call should be buffered, so it is fast, but it is checked by the AV, so it is not, leading to the convoy).
Because the Anti Virus was installed on both servers, they were both impacted, and the more load we put on them, the more the AV had to do, the more it slowed us down, the more requests we had queued, the bigger the trouble.
In other words, be very aware what is actually going on your system. As part of the post mortem analysis, we realized that we should have probably run fltmc.exe tool to check what are the file system filters that are installed and probably could have figured out that this is an Anti Virus issue much faster.
| Reference: | Production postmortem – The case of the infected cluster from our NCG partner Oren Eini at the Ayende @ Rahien blog. |