Read the previous article about the HighCharts.net component?
Ready to start with the HighCharts discovering?
Ok, let’s start with a very simple project.
I want to draw a line chart populating it with the data stored in a database table (so called databinding).
This tutorial uses data stored in a sql database.
If you need a smart SQL Editor to put in your application back end, you can read my post: C# SQL Editor
News!
- You can find this (an all others) example in my BitBucket public repository balsamino.com examples.
Web form
In order to show the chart I need to include some javascript and to place a literal component on my web form:
<html xmlns="http://www.w3.org/1999/xhtml">
   <head runat="server">
      <script type="text/javascript" src="http://ajax.googleapis.com/ajax/libs/jquery/1.7.1/jquery.min.js"></script>
      <script type="text/javascript" src="http://code.highcharts.com/highcharts.js"></script>
      <script type="text/javascript" src="http://code.highcharts.com/modules/exporting.js"></script>
     <title></title>
  </head>
  <body>
     <form id="form1" runat="server">
        <div>
           <asp:Literal id="chrtMyChart" runat="server"></asp:Literal>
        </div>
     </form>
  </body>
</html>
Now we have the container chrtMyChart for the chart.
Let’s see the codebehind part.
Codebehind
Add the references at the HighCharts component and create a function called Render_Chart
using DotNet.Highcharts.Enums;
using DotNet.Highcharts.Helpers;
using DotNet.Highcharts.Options;

protected void Render_Chart()

{

......

}
Now we need to place the chart inside the Render_Chart:
using DotNet.Highcharts.Enums;
using DotNet.Highcharts.Helpers;
using DotNet.Highcharts.Options;

protected void Render_Chart()

{
      DotNet.Highcharts.Highcharts chart = new DotNet.Highcharts.Highcharts("chart")
      .InitChart(new Chart { DefaultSeriesType = ChartTypes.Line })
      .SetTitle(new Title
      {
          Text = "Monthly Number of Pizza",
          X = -20
      })
     .SetSubtitle(new Subtitle
     {
         Text = "Source: Pizza Connect db",
         X = -20
     })
    .SetXAxis(new XAxis
    {
         Categories = new[] { "Jan", "Feb", "Mar", "Apr", "May", "Jun", "Jul", "Aug", "Sep", "Oct", "Nov", "Dec" }
    })
   .SetSeries(new[]
   {
        new Series { Name = "# Pizza.",         Data = new Data(chartValues)},
    });

    chrtMyChart.Text = chart.ToHtmlString(); }
The key points are two:
new Series { Name = “# Pizza”, Data = new Data(chartValues)}: here I’ve defined a serie called “# Pizza” declaring that the data will be taken from a chartValues object instead than an array.
ltrChart1.Text = chart.ToHtmlString(): here we render the chart into the literal placed on the webform.
Now is is the time to query the db and to bind the data to the chart.
// define the connection string

protected string constring = WebConfigurationManager.ConnectionStrings["myConnectionString"].ToString();

Declare the SQL connection

SqlConnection myConn = new SqlConnection(constring);

// and add a query string for retrieving the data.

string commandText = "select period, count(pizza) from pizzaDB group by period order by period";


SqlCommand myComm = new SqlCommand(commandText, myConn);
Open the connection to the server and execute the query:
myConn.Open();

SqlDataReader reader = myComm.ExecuteReader();
As we know the months in a year are 12, so let’s declare an array of 12 objects in order to store the data from the query:
Object[] chartValues = new Object[12]; // declare an object

if (reader.HasRows)
{

      while (reader.Read())
      {
               // GetValue() returns the data row from the query
               // So:
               //       GetValue(0) will contain the month number [month(eaten_Pizza) as Mese]
              //        GetValue(1) will contain the number of eaten pizzas [count(eaten_Pizza)]

                   chartValues[(Int32)reader.GetValue(0)-1] = reader.GetValue(1);                    // minus 1 because the array starts from 0, whenever the months start from 1
       }

}
else
{
       Console.WriteLine("No rows found.");
}

reader.Close(); // close the reader
Since we have the container for the chart and the object with the data form the dbase, now it is time to render the chart.
protected void Render_Chart()
{
// define the connection string
string constring = WebConfigurationManager.ConnectionStrings["exportDB"].ToString();
// Declare the SQL connection
SqlConnection myConn = new SqlConnection(constring);
// and add a query string for retrieving the data.
string commandText = "select period, count(pizza) from pizzaDB group by period order by period";
SqlCommand myComm = new SqlCommand(commandText, myConn);
// Open the connection
myConn.Open();
// and execute the query
SqlDataReader reader = myComm.ExecuteReader();
Object[] chartValues = new Object[12]; // declare an object for the chart rendering
if (reader.HasRows)
{
while (reader.Read())
{
// GetValue() returns the data row from the query
// So:
// GetValue(0) will contain the month number [<em>month(eaten_Pizza) as Mese</em>]
// GetValue(1) will contain the number of eaten pizzas [<em>count(eaten_Pizza)</em>]
chartValues[(Int32)reader.GetValue(0)-1] = reader.GetValue(1);
// minus 1 because the array starts from 0, whenever the months start from 1
}
}
else
{
Console.WriteLine("No rows found.");
}
reader.Close(); // close the reader
// Declare the HighCharts object
DotNet.Highcharts.Highcharts chart = new DotNet.Highcharts.Highcharts("chart").InitChart(new Chart { DefaultSeriesType = ChartTypes.Column })
.SetTitle(new Title
{
Text = "Monthly Number of Pizza",
X = -20
})
.SetSubtitle(new Subtitle
{
Text = "Source: Pizza Connect db",
X = -20
})
.SetXAxis(new XAxis
{
Categories = new[] {"Jan", "Feb", "Mar", "Apr", "May", "Jun", "Jul", "Aug", "Sep", "Oct", "Nov", "Dec" }
})
.SetSeries(new[]
{
new Series
{
Name = "# Pizza",
Data = new Data(chartValues) // Here we put the dbase data into the chart
},
});
chrtMyChart.Text = chart.ToHtmlString(); // Let's visualize the chart into the webform.
}
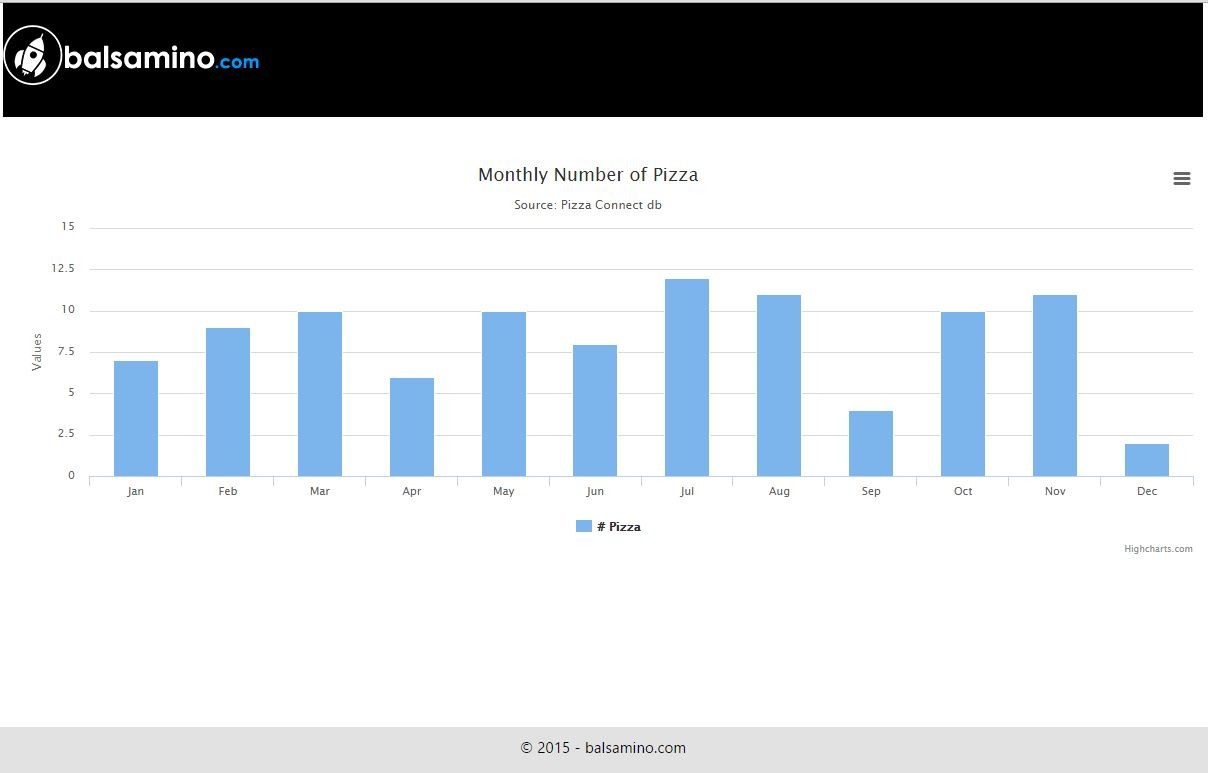
}So our task is complete!
This is the output our our work:
Let compact the code for clarity:
using System;
using System.Collections.Generic;
using System.Linq;
using System.Web;
using System.Web.UI;
using System.Web.UI.WebControls;

// Include the HighCharts controls
using DotNet.Highcharts.Enums;
using DotNet.Highcharts.Helpers;
using DotNet.Highcharts.Options;
using System.Web.Configuration;
using System.Data.SqlClient;

namespace balsamino_com.examples
{
    public partial class hghchrtsSimpleBind : System.Web.UI.Page
    {
        protected void Page_Load(object sender, EventArgs e)
        {
            Render_Chart();
        }


        protected void Render_Chart()
        {

            // define the connection string
            string constring = WebConfigurationManager.ConnectionStrings["exportDB"].ToString();

            // Declare the SQL connection

            SqlConnection myConn = new SqlConnection(constring);

            // and add a query string for retrieving the data.

            string commandText = "select period, count(pizza) from pizzaDB group by period order by period";

            SqlCommand myComm = new SqlCommand(commandText, myConn);

            // Open the connection
            myConn.Open();

            // and execute the query
            SqlDataReader reader = myComm.ExecuteReader();

            Object[] chartValues = new Object[12]; // declare an object for the chart rendering
            if (reader.HasRows)
            {
                    while (reader.Read())
                    {
                        // GetValue() returns the data row from the query
                        // So:
                        //       GetValue(0) will contain the month number [<em>month(eaten_Pizza) as Mese</em>]
                        //       GetValue(1) will contain the number of eaten pizzas [<em>count(eaten_Pizza)</em>]

                        chartValues[(Int32)reader.GetValue(0)-1] = reader.GetValue(1);
                        // minus 1 because the array starts from 0, whenever the months start from 1
                    }

            }
            else
            {
                    Console.WriteLine("No rows found.");
            }

            reader.Close(); // close the reader

            // Declare the HighCharts object
            DotNet.Highcharts.Highcharts chart = new DotNet.Highcharts.Highcharts("chart").InitChart(new Chart { DefaultSeriesType = ChartTypes.Column })
                .SetTitle(new Title
                {
                    Text = "Monthly Number of Pizza",
                    X = -20
                })
                .SetSubtitle(new Subtitle
                {
                    Text = "Source: Pizza Connect db",
                    X = -20
                })
                .SetXAxis(new XAxis
                {
                    Categories = new[] {"Jan", "Feb", "Mar", "Apr", "May", "Jun", "Jul", "Aug", "Sep", "Oct", "Nov", "Dec" }
                })
                .SetSeries(new[]
                        {
                        new Series
                        {
                            Name = "# Pizza",
                            Data = new Data(chartValues)   // Here we put the dbase data into the chart
                        },
                    });


            chrtMyChart.Text = chart.ToHtmlString(); // Let's visualize the chart into the webform.

        }
     }


}| Reference: | HighCharts databinding in C# from our NCG partner Francesco Balsamo at the balsamino.com blog. |