This is a recent case. One of our customers complained that every now and then they started to see very high memory utilization, escalating quickly until the system would bog down and die. They were able to deploy a mitigation strategy of a sort, when they detected this behavioral pattern, they would force RavenDB to reject client requests for a short while, which would fix this issue.
This went on for a while, because the behavior was utterly random. It didn’t seem to relate to load, peek usage time on the system didn’t correlate to this in any way. Eventually the customer raised another issue, that a certain spatial query was behaving very slowly in the logs.
We tested that, and we found that the customer was correct. More properly, the query executed just fine when run independently. But when we run this query tens or hundreds of times concurrently, we will see very high response times (and getting worse), and we would see the server memory just blowing up very quickly. So we have a memory leak, we figured out, let us see what is going on… We dumped the data, and tried to figure out what it was exactly that we were leaking.
But there wasn’t anything there!
In fact, looking at the problem, it became even curiouser. Take a look at what we saw during one of the test runs:
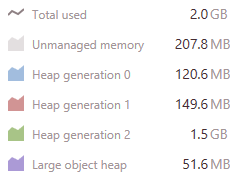
Note that this is all running with no other work, just a lot of queries hitting the server.
Somehow, we had a lot of data going into the Gen2 heap. But when we checked the Gen2, it was pretty much empty. In fact, we had a 100% fragmentation. Something was very strange here. We enabled memory allocation tracking and started to look into what was going on. We found this very suspicious (note that this is from a different run from the one above):
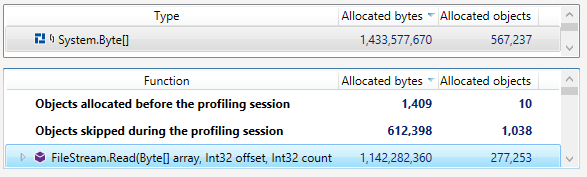
So FileStream.Read is allocating GBs over GBs of memory? What is going on?! It took a while to figure out what was going on. The underlying issue was within Lucene. Actually, an intersection of a few things inside Lucene.
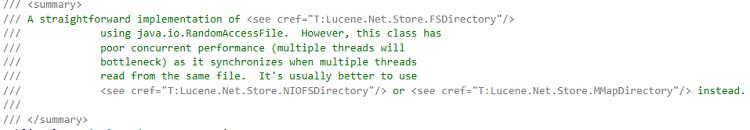
Here is how Lucene reads from a file on disk:
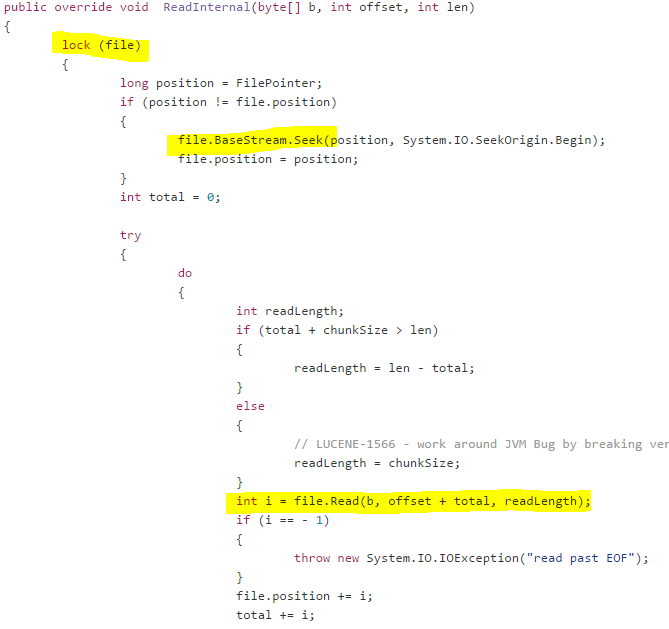
What you’ll notice is that Lucene is holding a lock on the file, and then issuing I/O. In other words, it is going to hold that lock for a while. This is a very strange thing to do, why is Lucene doing it?
It does this because of a strange decision on how to do concurrent I/O.
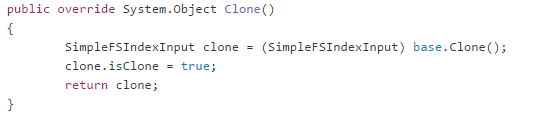
Basically, whenever Lucene needs to do concurrent I/O, it will clone the relevant input object, and then use it concurrently. The idea, I gather, is that Lucene didn’t want to have a separate file handle for each multi threaded operation, instead it created one file handle, and used it concurrently. Since concurrent I/O takes careful usage, they slapped a lock on it and call it a day. I’m being unfair, I know, this is explicitly called out in the docs:
And in the Java version, there is an NIOFSDirectory that is presumably much better. Such doesn’t exist in the Lucene.Net version we are using. In fact, I was curious and I checked the upcoming version, they do have a NIOFSDirectory implementation, which had the following code in it:
This is a single global lock for everything. Thank you, I’ll take the lock per file. Now, to be fair again, work in progress, etc.
We noticed this issue a long while ago, and we solved it by using multiple FileStreams. It used more resources, but it meant that we were far more concurrent. Note that all of this actually happened years ago, and we had no problems in this area. Note that Linux program typically worry a lot more about the number of open file handles than Windows programs do.
The problem was definitely related to the use of multiple FileStream. But it didn’t have anything to do with holding multiple handles to the same file. Instead, the issue was in the usage pattern that the query exhibited.
In particular, and I’m going to get deep into Lucene here, the problem was inside the SegmentReader.Terms() method:
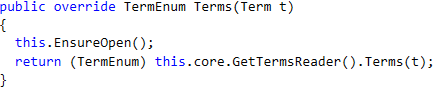
This seem innocuous, right? Here is how this is implemented:
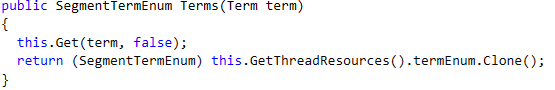
And all the way down until we gets to the input.Clone() method. Now, in a standard Lucene system, using concurrent queries, this would result in a fair amount of locking. In RavenDB, this just meant that we were creating new FileStream objects.
The problem was that this particular query had a list of terms that it needed to check, and it called the Terms() method many times. How much is many times? 12,000 times!
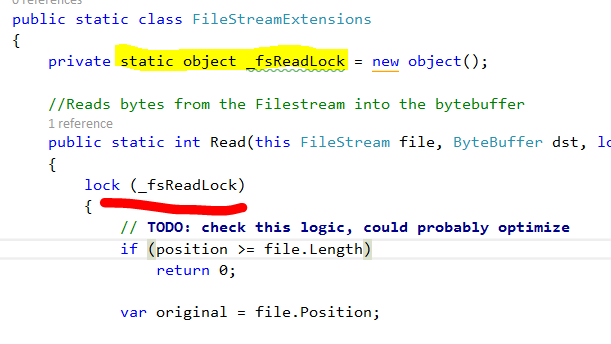
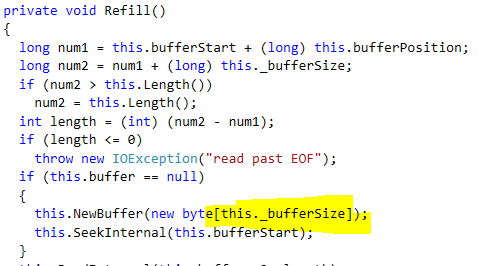
Still not a problem, except that it called FileStream.Read on each and every one of those. And FileStream.Read does the following:

And the _bufferSize is set to the default of 4KB.
In other words, processing a single instance of this particular query will result in the system allocating about 48MB of memory!
And when we have concurrent queries of this type? Each of them is allocating 48 MB of memory, and because they allocate so much, we have GC runs, which cause the memory (which is still in use) to be sent to Gen 1, and eventually park in Gen 2. There is languish (because it is temporary memory, but we don’t clear Gen 2 very often).
We changed the implementation to use overlapped I/O and tested that, and the memory consumption dropped by a significant number. But we still saw more allocations than we liked. We ended up tracking that down the this call (in BufferedIndexInput in the Lucene codebase):
The buffer size in this case is 1KB. So allocation for this query was actually 60 MB(!), and we only managed to drop it by 48MB.
After fighting with this for a long while, we ended scratch the whole buffered index input idea. It is just not sustainable in terms of allocations. Instead, we created a memory map input class, that map the input data once, and doesn’t use a buffer (so no allocations). With that option, our cost to process this query was drastically lower.
We profile the change, to see whatever there are additional issues, and we found that the newly optimized code was much better, but still had an issue. The memory map code used the UnmanagedMemoryStream class to expose the file to the rest of the application. Unfortunately, this class appears to be intended for concurrent usage, which is a rarity for Streams. Here is ReadByte method from that class: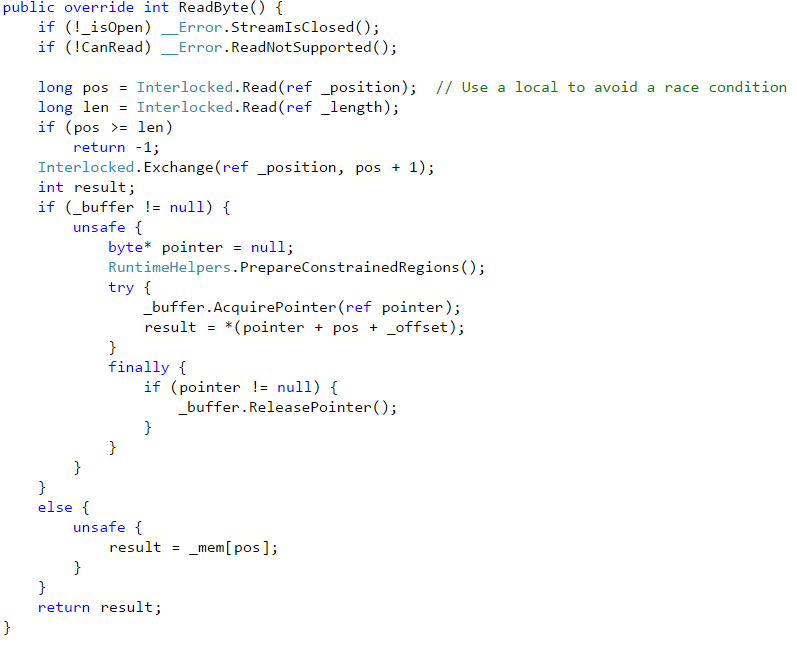
As you can see, this method is doing quite a lot. And it showed up as a hot spot in our profiling. The rest of the class is pretty complex as well, and does significantly more than what we actually need it to do.
We replaced this with a MmapStream class, and here is the comparable implementation.
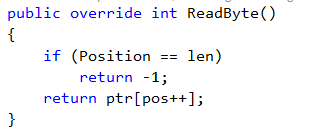
You can safely assume that this is much faster.
We have tested this using 5000 concurrent requests, without caching. Memory consumption is steady, and doesn’t increase. We show marked improvement across the board, in memory utilization, CPU usage and I/O rates. Note that while this issue was caused by a particular query whose pattern of operation caused tremendous number of allocations, this change has wider reaching implications.
We now allocate less memory for all queries, and previous experience has shown us that reducing a single 4Kb allocation in query processing can improve overall performance but 30%. We haven’t run those tests yet, but I’ll be surprised if we’ll see negative results.
| Reference: | Production postmortem – The case of the memory eater and high load from our NCG partner Oren Eini at the Ayende @ Rahien blog. |