One of the things we learned from build high performance systems is that algorithm complexity is important for system performance, but it is (usually) easy to see.
Controlling allocations is something that you don’t see. But it can have an even greater impact on your system. In particular, allocations require some CPU cost immediately, but the .NET framework is pretty good about keeping that small. In most cases, that require only bumping a counter value and giving you some memory. The true cost of allocations happen when you need to release that memory. GC, compactions, multiple generations, etc.
There are whole fields of study that deal with optimizing this issue. The downside of allocating a lot of memory is that you are going to pay the cost later. And that figuring out what exactly allocated that memory can often be quite hard. Especially if you are trying to figure it out from a production trace.
And even with the state of the art GC and memory management subsystems, your best bet to reduce memory management pressure is to reduce the number of allocations. We are far from the first to run into this. In fact, see the guidelines to contributing to Roslyn.
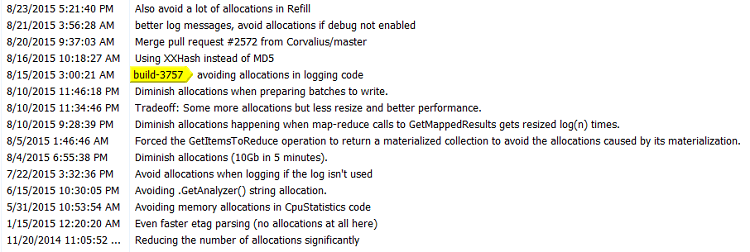
With RavenDB, here are a few commit messages dealing (only) with this issue:
The results of the performance improvements on those cannot really be overstated. In some cases, we save an allocation by just 8 or 16 bytes. But in a hot path, that means that we reduce GB of memory being allocated.
The problems with allocations is that they can be pretty well hidden, here are a code sample with hidden allocations:
var fileNames = new List<Tuple<string, bool>>();
foreach (var file in System.IO.Directory.GetFiles(dirToCheck, "*.dat"))
{
    using (var fs = new FileStream(file, FileMode.Open))
    {
        uint crc = CalculateCrc(fs);
        var crcStr = File.ReadAllText(file+".crc");
        var crcMatch = crc == int.Parse(crcStr);
        fileNames.Add(Tuple.Create<string, bool>(file, crcMatch));
    }
}
We will assume that CalculateCrc does absolutely no allocations, just calling ReadByte() until the end. We’ll further assume that there are 10,000 files in the directory.
How much memory is going to be allocated here? I’ll freely admit that I’ll probably miss some, but here is what I found:
- The fileNames list, which will allocate (using power of 2) a total of 256KB (32,764 items total in the list below, times 8 bytes per pointer)
new Tuple<string,bool>[4]
new Tuple<string,bool>[8]
new Tuple<string,bool>[16]
new Tuple<string,bool>[32]
new Tuple<string,bool>[64]
new Tuple<string,bool>[128]
new Tuple<string,bool>[256]
new Tuple<string,bool>[512]
new Tuple<string,bool>[1024]
new Tuple<string,bool>[2048]
new Tuple<string,bool>[4096]
new Tuple<string,bool>[8192]
new Tuple<string,bool>[16384] <—This goes in the large object heap, is is 128Kb in size
- The call to GetFiles will allocate about 0.5MB:
- It also uses a list internally, then it calls ToArray on it, so the same costs as the list, plus another 78Kb for the array. And another 128Kb buffer is in the large object heap.
- Note that I didn’t went too deep into the code, there are other allocations there, but it uses an enumerator internally (to feed the list), so I’ll assume not allocations.
- Creating a FileStream isn’t all that expensive, but reading from it (which is done in the CalculateCrc method) will force it to allocate a 4KB buffer. So that is 39MB right there.
- File.ReadAllText is a really nice convenience method, but it uses a StreamReader internally, which has a 1Kb buffer, and that uses a FileStream, which has yet another 4Kb buffer. So another 48MB.
- 10,000 strings for the file names returned from GetFiles, assuming that each file name is 8.3 characters, that gives us 107Kb.
- 10,000 strings for the CRC values we read using ReadAllText, assuming each is also 11 characters (text value of 0x576B6624), we get another 107Kb.
- Oh, and I almost forgot, we have another 10,000 strings allocated here, the file+”.crc” filename, which is another 146Kb.
- Finally, we have 10,000 tuples, which comes to about 90Kb.
Overall, calling this method will allocate about 90MB(!), including several allocations that fall into the large object heap.
Note that most of those calls are done on your behalf, inside the List handling, but mostly instead the I/O routines.
It has been our experience that allocations inside various I/O routines are a really common problem, especially when you have no way to send your own buffer (which you can pool, reuse, etc). For example, there is no way to share the buffer between different FileStreams instances.
I created a Pull Request in CoreCLR for this feature. But in the meantime, profiling memory allocations (vs. just the memory used) is a great way to find such issues.
| Reference: | The insidious cost of allocations from our NCG partner Oren Eini at the Ayende @ Rahien blog. |